

Introducing the AgendaWorx Dashboard
Signed, approved, outstanding and by whom, plus every action done, reminder sent and agenda coming up, across all your agendas and minutes.
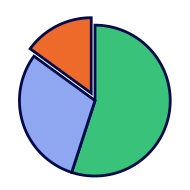
Every signature and approval is counted as it happens. Open items carry a name, so you know who to follow up.
Actions & reminders
See which actions are complete, which are still open, and every reminder sent: to whom and on which date.
Agendas & minutes
Upcoming agendas sit beside their send dates, with overdue and sent-late packs flagged in colour.
UPCOMING & RECENT AGENDAS

ACTION ITEMS: WHO OWES WHAT

The live lists. Status, owner and date on every line. Click View Agenda to jump straight in.
Your charts, your way
Line, bar or pie: choose what makes sense for you and your trustees, then drag and drop it into place.

Reminders sent or actions closed, week by week.
Outstanding items per trustee or per committee.
Signed vs. pending vs. overdue, at a glance.
See how easy it is
Pick a chart from the sidebar, drop it onto your dashboard, then choose the data, date range and per-user view. Arrange it all in your own layout.
Line, bar, pie, list, heading and divider blocks, placed wherever you want them.
Text, borders, corners and spacing to match your board.
Every agenda and set of minutes, refreshed on demand and exportable to Excel.

Find it in your Admin Portal (CMS) under Dashboard
| 1 Open Site Builder › Dashboard | 2 Drag a line, bar, pie or list onto the page | 3 Choose the data, date range and per-user view | 4 Set your colours and click Save Changes |


